Using DuckDB+dbt, FastAPI for Real-Time Analytics
In this post I’ll demonstrate how to use DuckDB, an in memory SQL engine, optimized to perform on big data within your laptop, to serve a real-time analytics use case, served by FastAPI and using dbt as the data build tool to manage the pipeline functionality.
DuckDB is the component that will actually be performing all the work, it is a fast (and getting faster) in memory database that uses a dialect based on Postgres, the Python client has some nice fancy features that we will take advantage of in this article.
dbt is a tool used to perform the transform in Extract Load Transform (ELT) it allows you to write out a set of SQL queries and deploy them into a database and several other excellent quality of life features that bring SQL into the 21st century with respect to the Software Development Life-Cycle (SDLC). In this project it will be used to deploy a set of views to a DuckDB database file that the API will consume.
FastAPI is a great REST API server for Python, it integrates well with pydantic, allowing you to write fast and well typed APIs quickly and efficiently. We will POST the source data to this endpoint which it will use to invoke duckdb to execute the pipeline defined using dbt.
Walkthrough
The repository can be found here github.com/Nintorac/duckapi, you can follow along there. I assume some familiarity with all of the tools involved, and just talk about the specific patterns implemented here that make it interesting.
Data
In this contrived example of an analytics workload we take a dataset with two columns, group_id, and event_value, (naming could have been better there). Let’s interpret the group_id column as a key to identify a populations of animals, and the event_value as the number of new babies born in a season, (the season being redacted for confidentiality purposes.)
Here is an example of how the data could look.
| group_id (Animal groups) | event_value (# newborn animals) |
|---|---|
| 🦆 | 13 |
| 🐇 | 8 |
| 🐰 | 2 |
| 🐰 | 5 |
| 🦆 | 3 |
| 🐇 | 23 |
| 🐇 | 1 |
| 🦆 | 17 |
| 🐰 | 5 |
And on this dataset we will calculate various statistics, for example the total newborn animals over all seasons for each group, the histogram heights for number of births per group, the histogram heights for the number birth in total etc.
dbt
In dbt we handle a few things
- Set up some example data
- Define a set of analyses that compute statistics on the input data
- Some glue queries to setup the analysis and combine the results
- Configure the analyses to be deployed as views
- Configure dbt to use duckdb as its datastore
- Deploy the pipeline to the database!
Example data
To set up the example data we use dbt seeds, this allows us to deploy a local CSV file into the database, any CSV’s we put in the seeds folder (duckapi_dbt/seeds) will be written into the database. In here we also create a schema.yml file which allows us to add documentation, tests and other information. We use it to type the supplied columns, though not strictly necessary, (DuckDB will auto-detect the types anyway) it is often good to be explicit.
Define analysis queries
Next we define a set of analyses that we want to perform on the dataset (duckapi_dbt/models/analyses), the actual work being done here will vary from use case to use case, and in this example we just demonstrate collecting various statistics about the data. Lets have a look at one of the analyses.
duckapi_dbt/models/analyses/group_sums.sql
select
    group_id
    , sum(event_value) as value_sum
from {{ ref('group_event_values') }}
group by group_id
This query simply calculates the sum of the event_value column, grouped by the group_id, in the context of the animals example this amounts to calculating the total number of baby animals per animal group. The rest of the analyses follow a similar pattern, as you can see all of the analysis is simply some SQL.
Glue it together
Now lets look at the glue that lets us hang this all together, first we have duckapi_dbt/models/group_event_values.sql, this is a simple select * from example_data, essentially just copying the data from the seed table into this view. This will be the source view for all the analysis that are implemented. Later on we will replace this view with a new one that supplies the data from a user request.
Then there is duckapi_dbt/models/analysis.sql, this query collates all the different analyses as separate columns, each of these columns will be a complex datatype, this is the final data structure that we will be returning from the API.
Here is the DDL (if we were to deploy this as a table)
CREATE TABLE dev.main.analysis (
    group_sums STRUCT(
        group_id VARCHAR,
        value_sum HUGEINT
    )[],
    group_sets STRUCT(
        group_id VARCHAR,
        group_value_set INTEGER[]
    )[],
    group_event_value_histogram STRUCT(
        group_id VARCHAR,
        event_value INTEGER,
        group_event_value_count BIGINT
    )[],
    group_histogram STRUCT(
        group_id VARCHAR,
        group_count BIGINT
    )[],
    hist_event_values STRUCT(
        event_value INTEGER,
        event_value_count BIGINT
    )[],
    hist_group_event_values STRUCT(
        group_id VARCHAR,
        event_value INTEGER,
        group_event_value_count BIGINT
    )[],
    hist_groups STRUCT(
        group_id VARCHAR,
        group_count BIGINT
    )[]
);
Configure as view
One last thing to do before we can produce the database is to configure how we want the various parts of the analyses to the database. In this case, everything will be deployed as views, so we edit duckapi_dbt/dbt_project.yml to look like this
models:
  duckapi_dbt:
    +materialized: view
This will deploy all models in the dbt project as views in DuckDB.
Configure the dbt-duckdb adapater
Not much to see here, and if you setup your dbt project using dbt init then this will be created for you. This is configured using duckapi_dbt/profiles.yml, normally dbt will store this at ~/.dbt/profiles.yml however we want this file under version control along with the rest of the project so we write it here instead. (Check out the .env file to understand how we are able to use this profiles.yml seamlessly).
I do recommend reading through the dbt-duckdb documentation on this adapter, as with all the configuration options it is a really powerful way to configure your DuckDB connection!
Deploy the pipeline
With that all done, we can generate the database, this is done with a simple dbt build which will add the seed data to the database, deploy the views and run any tests we’ve defined.
If you do this you’ll notice the test is failing, the issue is non-deterministic order of query results, I leave turning it green as a pointless exercise to the reader.
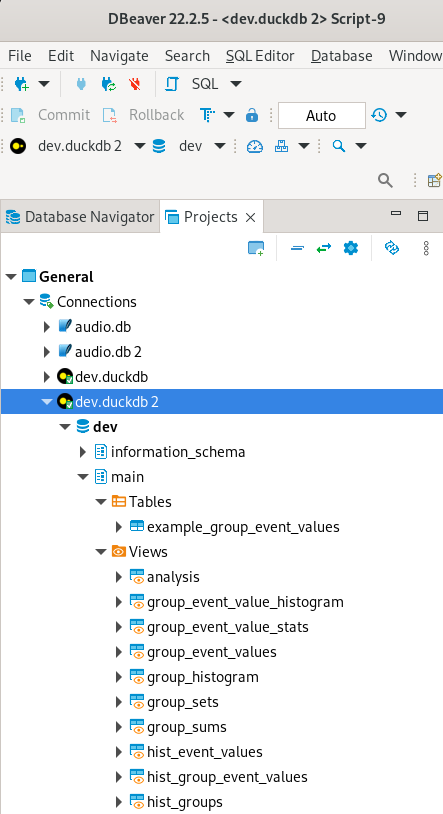
Having run the command you will now see that you have a file name dev.duckdb that has been created. I encourage you to dive into it. I use DBeaver for this.
FastAPI
FastAPI component is simple enough to fit in a few lines, so here it is verbatim.
class GroupEventValue(BaseModel):
    group_id: str
    event_value: int

Entries = list[GroupEventValue

@app.post("/analyse_data/")
async def analyse_data(entries: Entries):

    if len(entries)==0:
        return []

    # Run the datapipeline over the list of entries
    entries_adapter = TypeAdapter(Entries)
    group_event_values_df = pd.DataFrame(entries_adapter.dump_python(entries))

    duck = duckdb.connect('dev.duckdb')
    t = duck.begin()

    # heart of the method
    # replace view of the example data
    t.execute('create or replace view group_event_values as \
        select group_id, event_value::int event_value from group_event_values_df')
    # fetch results based on data from group_event_values_df
    result = t.query('select * from analysis').to_df().to_json(orient='records')

    t.rollback() # roll back transaction to leave db in a good state

    return Response(content=str(result), media_type='application/json')
We define the expected data type of the input using pydantic, this is the GroupEventValue class, we actually expect a list of these so we create a type Entries to represent this.
Then we define a POST endpoint at /analyse_data which accepts the Entries datatype. This endpoint expects a JSON payload that matches the structure of Entries, FastAPI does the work of validating the inputs behind the scenes and delivers us the instantiated Entries data.
Next we use the handy TypeAdapter to turn our Entries object, which is a list of GroupEventValues into a pure Python object, and create a Pandas DataFrame from the resulting list, this will be the input data the the pipeline.
Now we instantiate the DuckDB connection, this probably isn’t best practice and wouldn’t work for concurrent requests, but improving this is another exercise left to the reader. From this we create a transaction, since we don’t want to actually alter the database and will use this only to rollback the changes we make in later steps.
Finally, for the heart of the solution, we first replace the group_event_values view (which you’ll remember from before, copies the example data and is the source table for all the analyses), we will replace this with a view over the DataFrame we just created (using the magic of DuckDB’s ability to query Pandas directly in Python).
Then we simply query the analysis table, since we have replaced the example data with the request data in the database using the create or replace view directive, the output from this query is now the analyses based on the data from the request! We dump this query result into JSON and return it. Simples!(?)
Trying things out
First edit the .env file so that PROJECT_ROOT var is pointing to the root of this repository.
Then, (assuming you already have conda installed),
conda create -n duckapi python=3.10 -y
conda activate duckapi
pip install poetry
make install_dev
make test
If the tests pass then your environment is configured correctly and you are ready to go!
Now run dbt build to produce the database that the API will use to execute the data pipeline.
With that in place you can run the API using make run_api
Now we can run our analysis for the animals example.
curl -s -X POST -H "Content-Type: application/json" \
-d '[{"group_id": "🦆", "event_value": 13}, {"group_id": "🐇", "event_value": 8}, {"group_id": "🐰", "event_value": 2}, {"group_id": "🐰", "event_value": 5}, {"group_id": "🦆", "event_value": 3}, {"group_id": "🐇", "event_value": 23}, {"group_id": "🐇", "event_value": 1}, {"group_id": "🦆", "event_value": 17}, {"group_id": "🐰", "event_value": 5}]' http://localhost:8000/analyse_data/
Response:
[
  {
    "group_sums": [
      {
        "group_id": "🐇",
        "value_sum": 32
      },
      {
        "group_id": "🐰",
        "value_sum": 12
      },
      {
        "group_id": "🦆",
        "value_sum": 33
      }
    ],
    "group_sets": [
      {
        "group_id": "🐰",
        "group_value_set": [
          5,
          2
        ]
      },
      {
        "group_id": "🐇",
        "group_value_set": [
          8,
          23,
          1
        ]
      },
      {
        "group_id": "🦆",
        "group_value_set": [
          3,
          17,
          13
        ]
      }
    ],
    "group_event_value_histogram": [
      {
        "group_id": "🐇",
        "event_value": 1,
        "group_event_value_count": 1
      },
      {
        "group_id": "🦆",
        "event_value": 17,
        "group_event_value_count": 1
      },
      {
        "group_id": "🦆",
        "event_value": 13,
        "group_event_value_count": 1
      },
      {
        "group_id": "🐇",
        "event_value": 8,
        "group_event_value_count": 1
      },
      {
        "group_id": "🐇",
        "event_value": 23,
        "group_event_value_count": 1
      },
      {
        "group_id": "🐰",
        "event_value": 2,
        "group_event_value_count": 1
      },
      {
        "group_id": "🦆",
        "event_value": 3,
        "group_event_value_count": 1
      },
      {
        "group_id": "🐰",
        "event_value": 5,
        "group_event_value_count": 2
      }
    ],
    "group_histogram": [
      {
        "group_id": "🐇",
        "group_count": 3
      },
      {
        "group_id": "🦆",
        "group_count": 3
      },
      {
        "group_id": "🐰",
        "group_count": 3
      }
    ],
    "hist_event_values": [
      {
        "event_value": 13,
        "event_value_count": 1
      },
      {
        "event_value": 8,
        "event_value_count": 1
      },
      {
        "event_value": 3,
        "event_value_count": 1
      },
      {
        "event_value": 23,
        "event_value_count": 1
      },
      {
        "event_value": 1,
        "event_value_count": 1
      },
      {
        "event_value": 5,
        "event_value_count": 2
      },
      {
        "event_value": 17,
        "event_value_count": 1
      },
      {
        "event_value": 2,
        "event_value_count": 1
      }
    ],
    "hist_group_event_values": [
      {
        "group_id": "🐇",
        "event_value": 1,
        "group_event_value_count": 1
      },
      {
        "group_id": "🦆",
        "event_value": 17,
        "group_event_value_count": 1
      },
      {
        "group_id": "🐇",
        "event_value": 23,
        "group_event_value_count": 1
      },
      {
        "group_id": "🐇",
        "event_value": 8,
        "group_event_value_count": 1
      },
      {
        "group_id": "🐰",
        "event_value": 2,
        "group_event_value_count": 1
      },
      {
        "group_id": "🦆",
        "event_value": 3,
        "group_event_value_count": 1
      },
      {
        "group_id": "🦆",
        "event_value": 13,
        "group_event_value_count": 1
      },
      {
        "group_id": "🐰",
        "event_value": 5,
        "group_event_value_count": 2
      }
    ],
    "hist_groups": [
      {
        "group_id": "🦆",
        "group_count": 3
      },
      {
        "group_id": "🐇",
        "group_count": 3
      },
      {
        "group_id": "🐰",
        "group_count": 3
      }
    ]
  }
]
I’ve also added make make_request and make make_request_pretty which will run the curl for you and show you the results, use the pretty version if you have jq installed.
Potential Improvements
dbt provides a Python API, so in theory it should be possible to more tightly integrate dbt into this pattern. However the Python API seeems to be mostly a wrapper around the CLI so some more advanced ideas I had do not seem possible at present. For instance there doesn’t seem to be a way to pass the database client object into dbt when calling dbt from within Python.
If this capability was possible, it could be used to process more complex pipelines, users would be able to control the materialisation strategy of different sub-analysis components, which can be needed in memory intensive pipelines, example data would no longer be needed since the users real data could provide the initial schema, and the user could make use of macros to define dynamic pipelines, i.e being able to enable/disable different pieces of analysis based on user flags, or use dbt macros for data dependent transforms.
Conclusion
I can see it having utility when you have a data pipeline that can be used offline or online. Using this method would allow you to use the exact same transformations without having to rewrite anything and maintain consistency between two different pipeline implementations.
Want a challenge? Try to get this setup working in Spark!
I am not sure whether this is useful or not, or how well it will scale but I thought it was a fun thought exercise at least. Hope you found this interesting!